🚀 Task Manager
This Task Manager template is an easy-to-use, flexible and centralised solution to manage and kee...
🚀 Sales CRM
This Sales Tracker template is ideal for all teams and sizes. Whether you're managing a handful o...
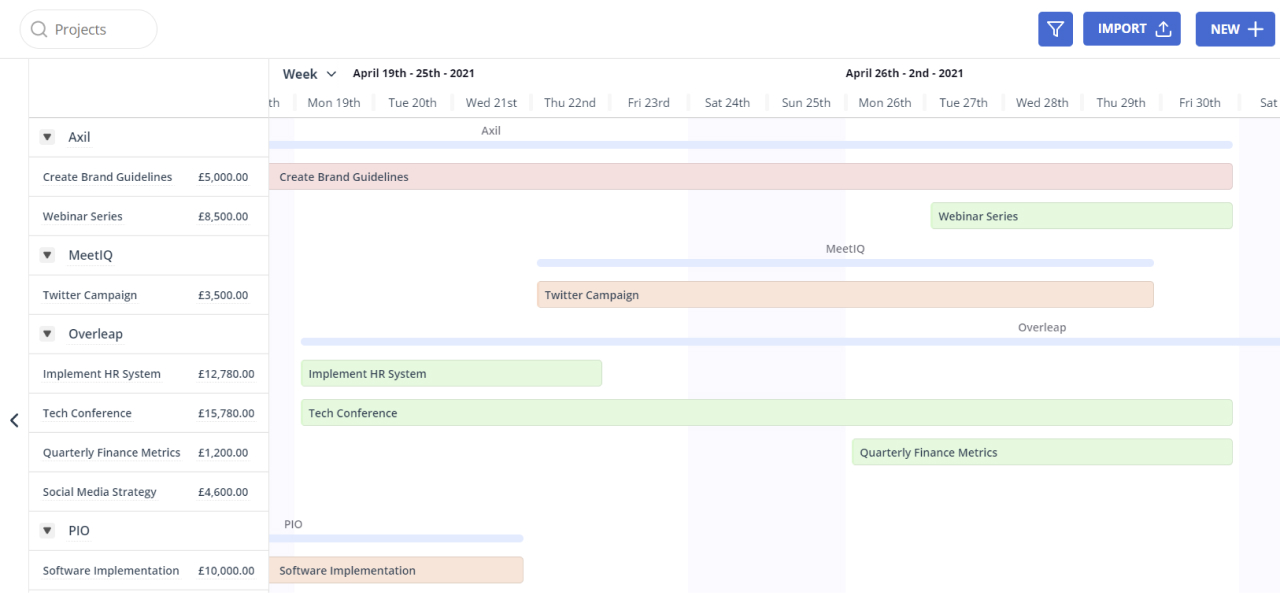
🚀 Project Manager
The Project Manager is the perfect template for tracking your projects and tasks. With the abili...
Applicant Tracker
This Applicant Tracker template provides a simple way to track any open job roles, whether you’re...
Campaign Manager
Perfect for start-ups and independent consultants, through to large-scale agencies and in-house m...
Holiday Planner
Gain complete visibility of days off across your teams with this simple Holiday Planner template....
New Starters
Streamline and simplify your new employee's onboarding process with this New Starters template. W...
Project Planner
Perfect for start-ups and freelancers, through to large-scale enterprises managing hundreds of pr...
Stock Control
This Stock Control template is perfect for tracking all of your product orders and sales. Whether...
Use Cases
Features
Create the perfect view
Create different screen types to display information how you want to see it. Choose from Grids, B...
Create the fields you need
Configure your project to choose what information you want to see, with our intuitive drag and dr...
Visualise your project data
Create Dashboards to provide a high-level overview of your projects, visualising data in formats ...
Import and export your data
Get up and running quickly by moving data from an existing system or spreadsheet using the import...
Gain real-time notifications with automations
Automate manual processes by using Workflows to create real-time notifications on events that mat...
Capture feedback and enquiries
Gather information quickly and efficiently from colleagues or customers using Gridfox Forms. Embe...
Control data access through permissions
Control access to data across your projects using granular user and group based permissions. Easi...
Create and link data tables
Build your own data model, linking together Tables to create relationships through our intuitive ...
Resources